The Atlanta REALTORS® Association has released their Atlanta Real Estate Market Brief — February 2019.
This market brief examines sales and prices in an 11-county area consisting of Cherokee, Clayton, Cobb, DeKalb, Douglas, Forsyth, Fulton, Gwinnett, Fayette, Henry and Paulding Counties. ( So take note…this is a really, really BROAD look at the real estate market in Metro Atlanta!)
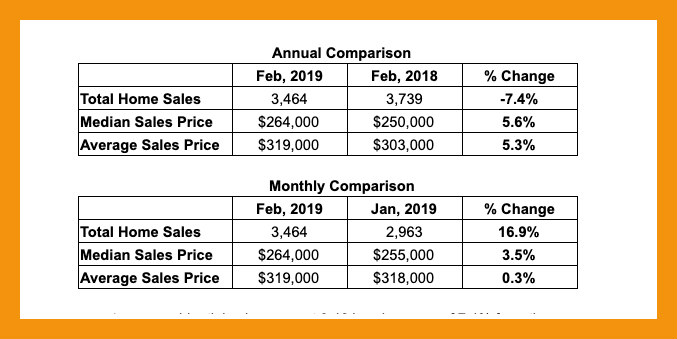
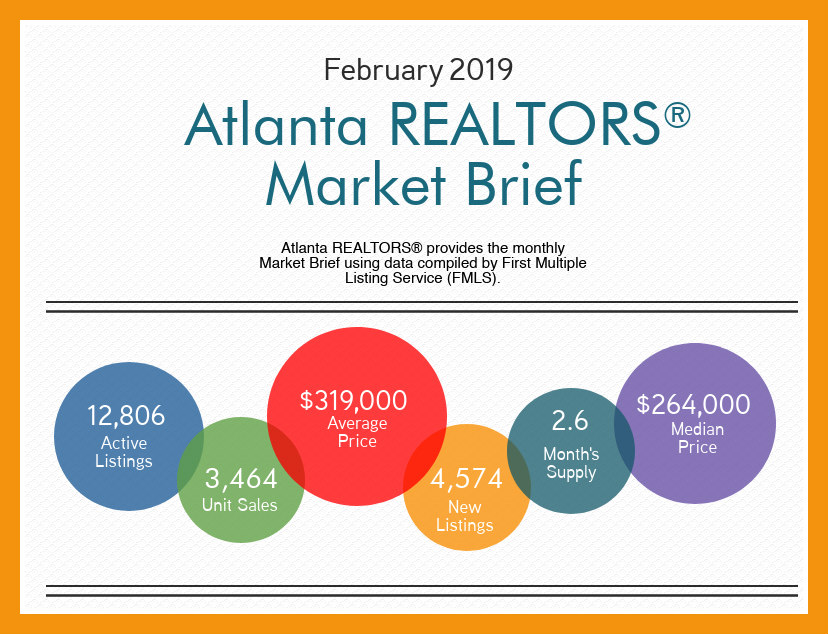
Overall residential sales were at 3,464 which is a decrease of 7.4% from the previous year. When you look at price (both average and median) you see they continue to gain traction and are ahead of 2018 numbers. The median sales price in February was $264,000, an increase of 5.6% from February, 2018. The average Sales Price was up by 5.3% to $319,000.
What’s The Atlanta Inventory Like?
Inventory increased by 15.7% from February, 2018 with 12,806 active listings. (Remember those MetroBrokers digital signs back in the day that had 80,000, 90,000 and even 100,000 homes For Sale? Shreeeeek!) New listings were up by 15.4% from February, 2018. The month’s supply over a 12-month period decreased to 2.6 months.
Is This A Normal Real Estate Market?
A normal real estate market has 6 months of inventory. Less than 6 months (as indicated above) is a Seller’s market, and more than 6 months is a Buyer’s market. More inventory means buyers can probably get the Seller to negotiate more on price or other concessions. In a Seller’s market, we find homes selling for list price, and even above list price.
My word of caution in a report as broad as this…..real estate is all about location, location, location. These average sales numbers are just that… an average and what you may see in your neighborhood, city or specific condominium building may vastly differ from these numbers. This is why it’s always best to get a real estate professional to give you a market picture for your home and neighborhood/building.
If you have questions about the value of your home, give us a call, or just fill out the form below and we will be in touch with you!


